
Um eine globale Infrastruktur zu optimieren, benötigen Sie detaillierte Daten darüber, wer Ihre Inhalte konsumiert. Das Übersetzungsanfragen Das Dashboard fungiert als Ihre zentrale Telemetrieeinheit. Es erfasst jede Instanz, in der die MultiLipi-Engine eine übersetzte Seite bereitstellt, und aggregiert diese Daten in Zeitreihenvisualisierungen. Dies ermöglicht es Ihnen, zwischen passiven Sprachen (aktiviert, aber ungenutzt) und aktiven Märkten (hoher Verbrauch) zu unterscheiden und Ihren Lokalisierungs-ROI zu validieren.
Diese Anleitung beschreibt die Navigation und Interpretation Ihrer linguistischen Verkehrsdaten.
2. Die Dashboard-Architektur
Die Signale verstehen.
A. Gesamtzahl der Übersetzungsanfragen (Die aggregierte Last)
Anzeige: Eine große numerische Anzeige oben im Panel.
Definition: Dies stellt die Gesamtzahl der "Übersetzungsaufrufe" dar, die an unsere API für alle Sprachen gesendet wurden.
Technischer Hinweis: Ein Aufruf wird ausgelöst, wenn ein Besucher eine Seite in einer Zielsprache lädt (über LiveJS, Unterverzeichnis oder Subdomain). Er ist ein direkter Indikator für "lokalisierte Seitenaufrufe".
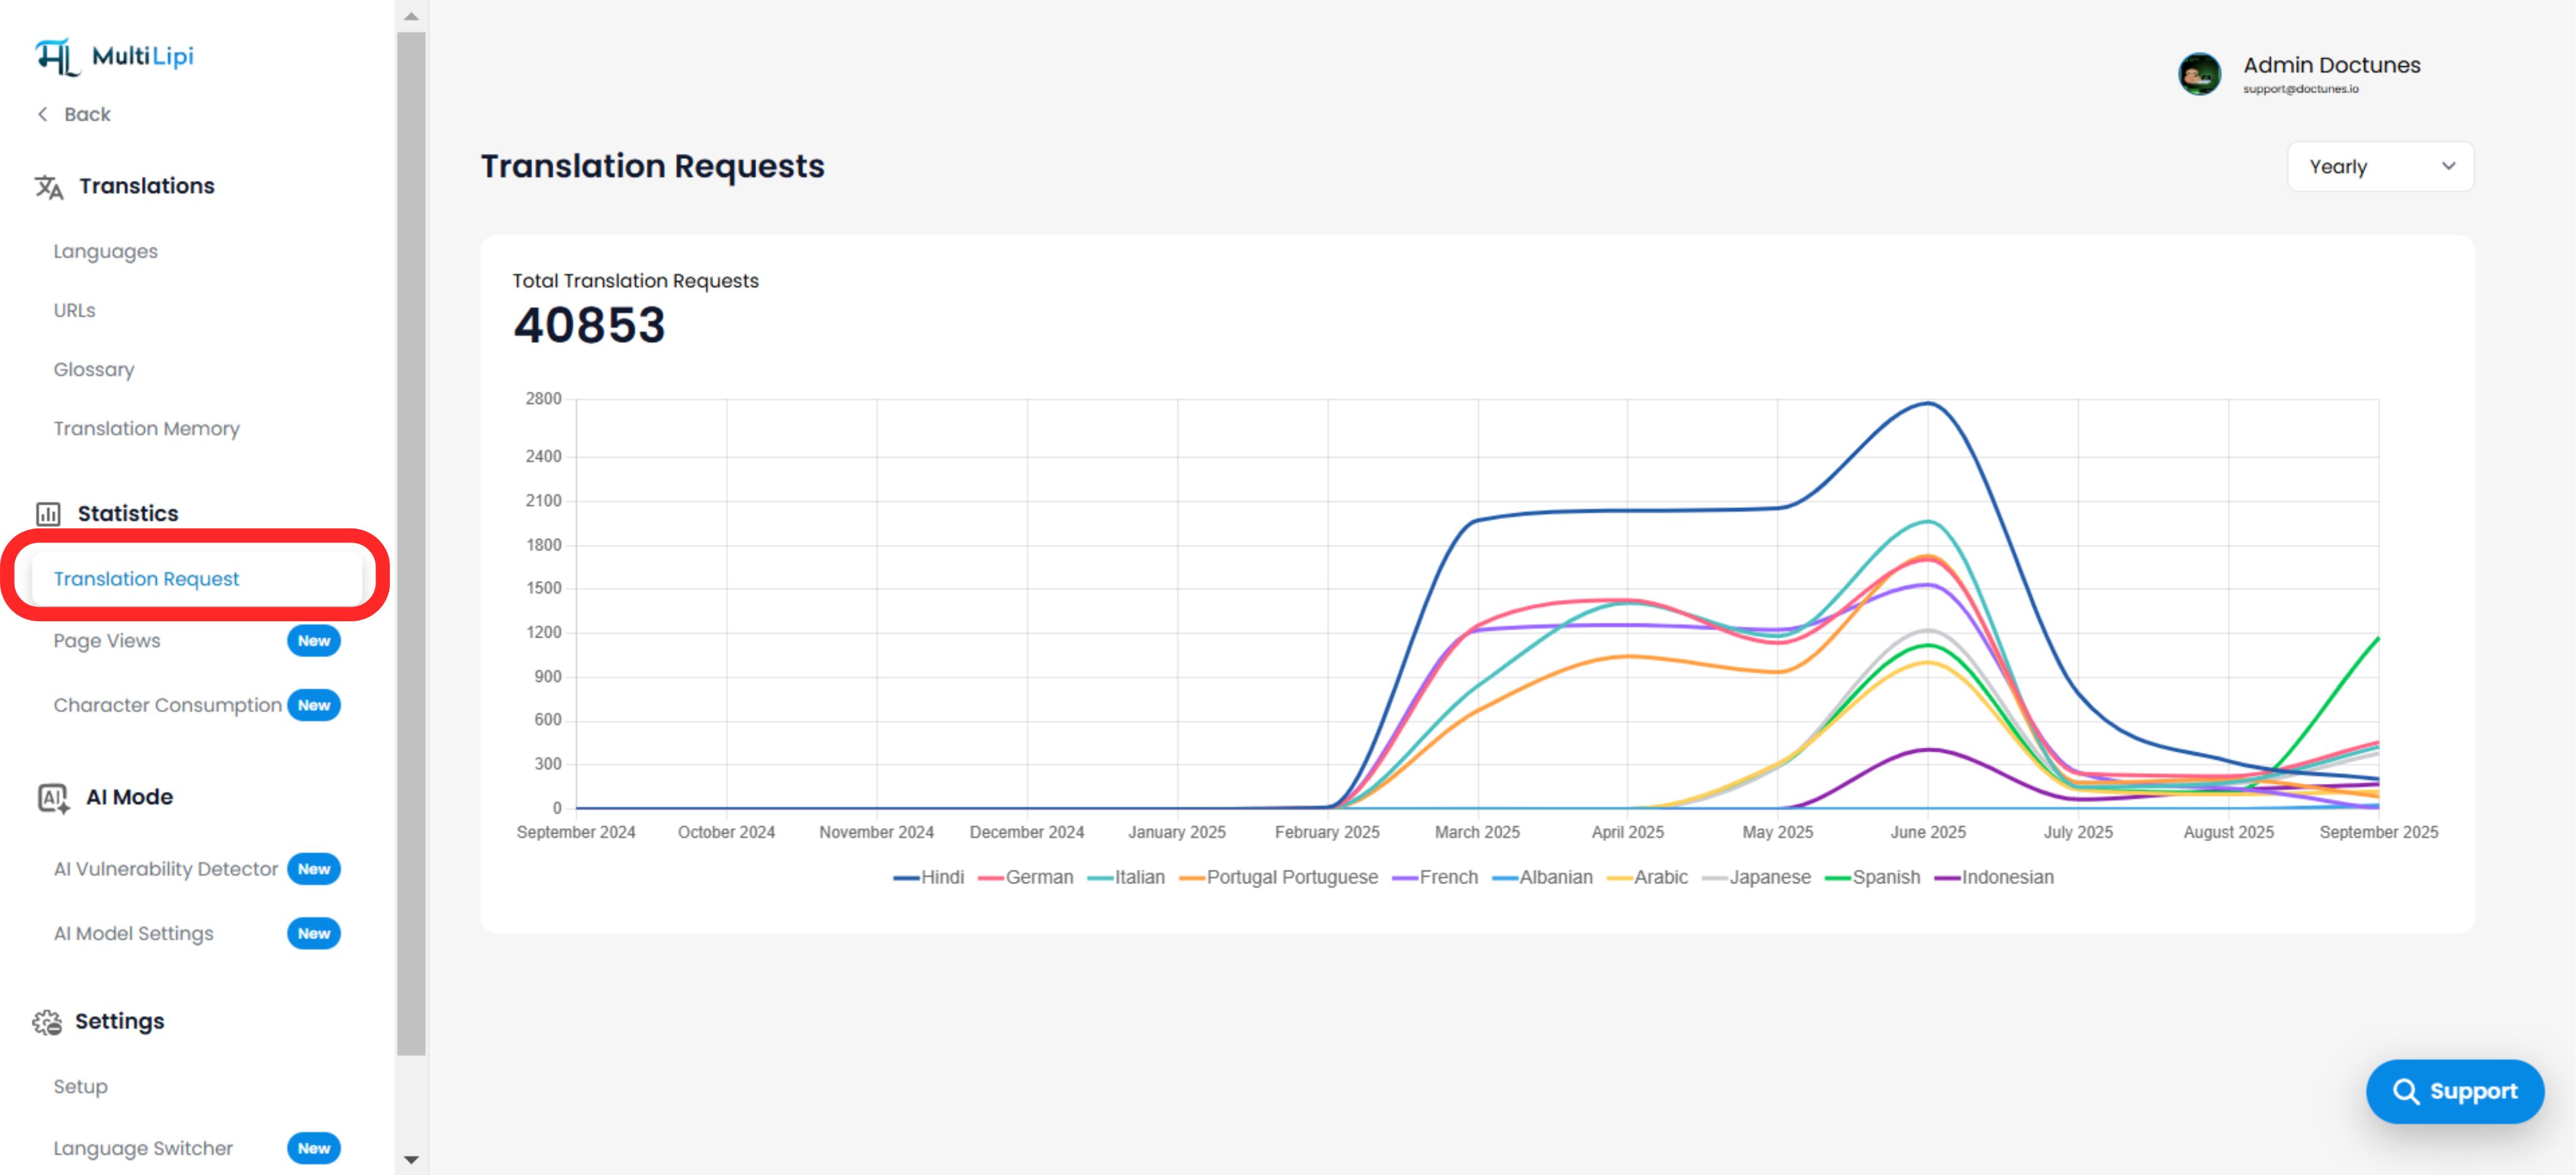
B. Sprachbezogene Zeitreihen (Der Trendgraph)
Visualisierung: Ein mehrfarbiges Liniendiagramm, das die Leistung im Zeitverlauf verfolgt.
Y-Achse (Volumen): Anzahl der Anfragen/Aufrufe.
X-Achse (Zeit): Zeitleiste (Monate/Wochen).
Legende: Jede Farbe repräsentiert eine bestimmte Sprache (z. B. Hindi = Blau, Spanisch = Rot).
Einblick: Diese Visualisierung zeigt Volatilität und Wachstum. Eine flache Linie zeigt Stagnation an; ein Anstieg zeigt eine erfolgreiche Kampagne oder ein virales Ereignis in dieser Region an.
3. Granularitätssteuerung (Zeitfilter)
Hineinzoomen in die Daten.
Sie können die Auflösung der Daten mit dem Filter-Dropdown im oberen rechten Eck anpassen:
| Filter | Anwendungsfall |
|---|---|
| Täglich | Fehlerbehebung: Ist der Traffic gestern auf Null gefallen? (Mögliches DNS-Problem). |
| Wöchentlich | Kampagnenverfolgung: Die unmittelbaren Auswirkungen einer neuen lokalisierten Anzeige verfolgen. |
| Monatlich | Leistungsberichterstattung: Übergeordnete Berichterstattung für Stakeholder. |
| Jährlich | Saisonalität: Langfristige Trends identifizieren (z. B. deutsche Traffic-Spitzen im Dezember). |
4. Strategische Intelligenz
Daten in Entscheidungen umwandeln.
Marktvalidierung
Wenn Sie im September 2025 einen signifikanten Anstieg des spanischen Traffics sehen, bestätigt dies, dass Ihre spanische Lokalisierung einen echten Mehrwert schafft. Sie könnten erwägen, mehr Inhalte für diese Region bereitzustellen.
Ressourcenallokation
Wenn Deutsch sechs Monate lang keine Anfragen hat, könnten Sie erwägen, es zu verwerfen oder zu untersuchen, ob der Sprachumschalter für deutsche Benutzer defekt ist.
SEO-Überwachung
Ein plötzlicher, anhaltender Anstieg in einer bestimmten Sprache weist oft darauf hin, dass Google begonnen hat, Ihre übersetzten Unterverzeichnisse zu indizieren (z. B. /hi/) für diese Region.